Crisp's business health dashboards provide the essential analytics for running a great food brand. This article focuses on the Walmart sales dashboard and its three sections: "Overview," or what's going on with your sales; "Drivers," or the events contributing to your sales; "Details," or granular information you can act on to improve your sales.
In this tutorial, you will learn about each visualization available through the Walmart dashboard. Quickly jump to a specific visualization by clicking the links below.
Sales
Sales, Products, Locations Scanning
Sales by Product
Sales by State
Sales by City, Region, District
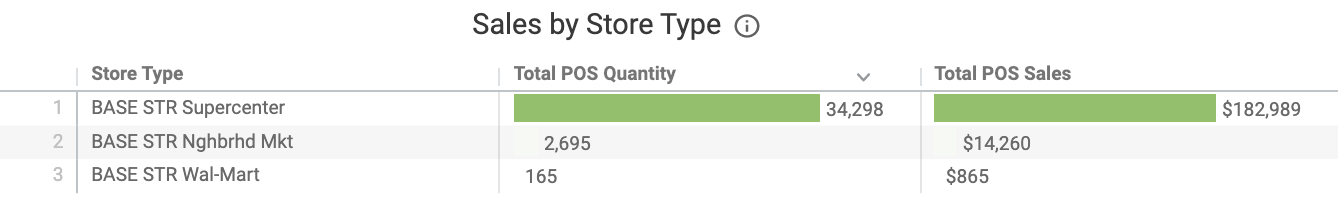
Sales by Store Type
Sales Details
Overview
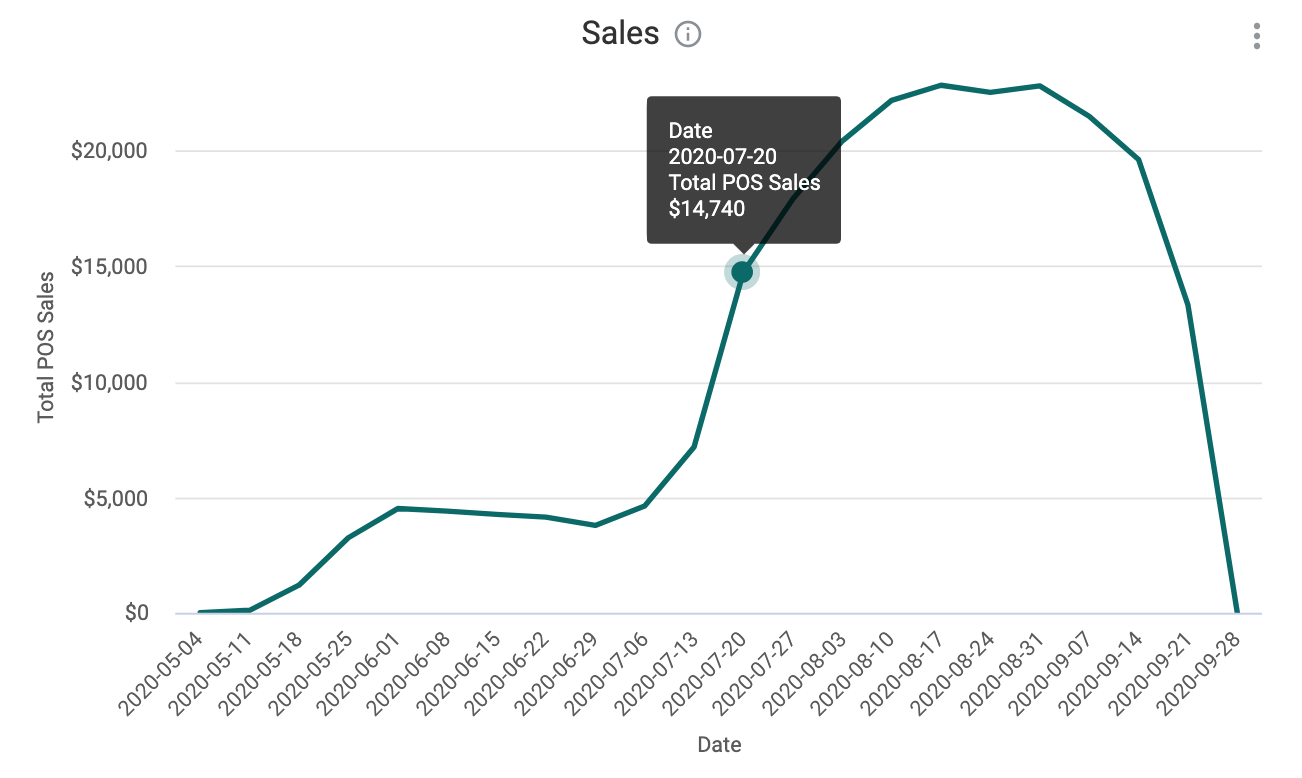
Sales
View sales trends over time. Along with adding filters to hone in on specific products or time periods, you can also hover over data points for more info. This visualization is especially useful for recognizing seasonal and cyclical patterns, analyzing promotions and item success, and demonstrating growth to other retailers or investors.
Sales, Products, Locations Scanning
These tiles add more context to the Sales graph and together provide high-level information about your sales performance and patterns. When you enable a cross filter, these tiles offer more granular insights, helping you better understand sales and distribution within a particular area.
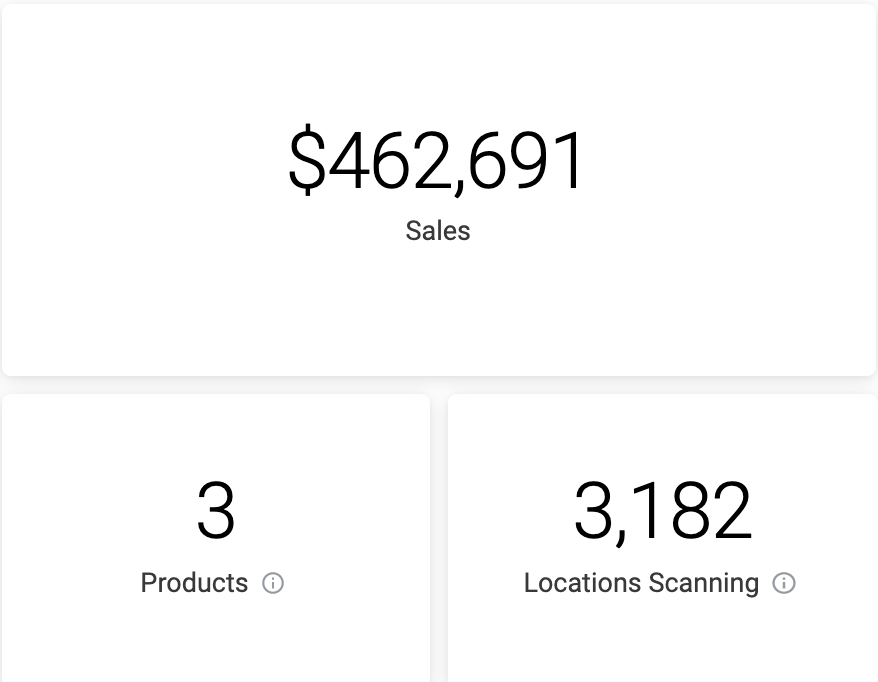
Right click the number above Locations Scanning to see the sales for actual locations that are scanning your product.
Right click the number above products to show actual sales from those locations.
Sales by Product
This sortable table shows your top-performing products and changes based on your selected filters.

Sales Drivers
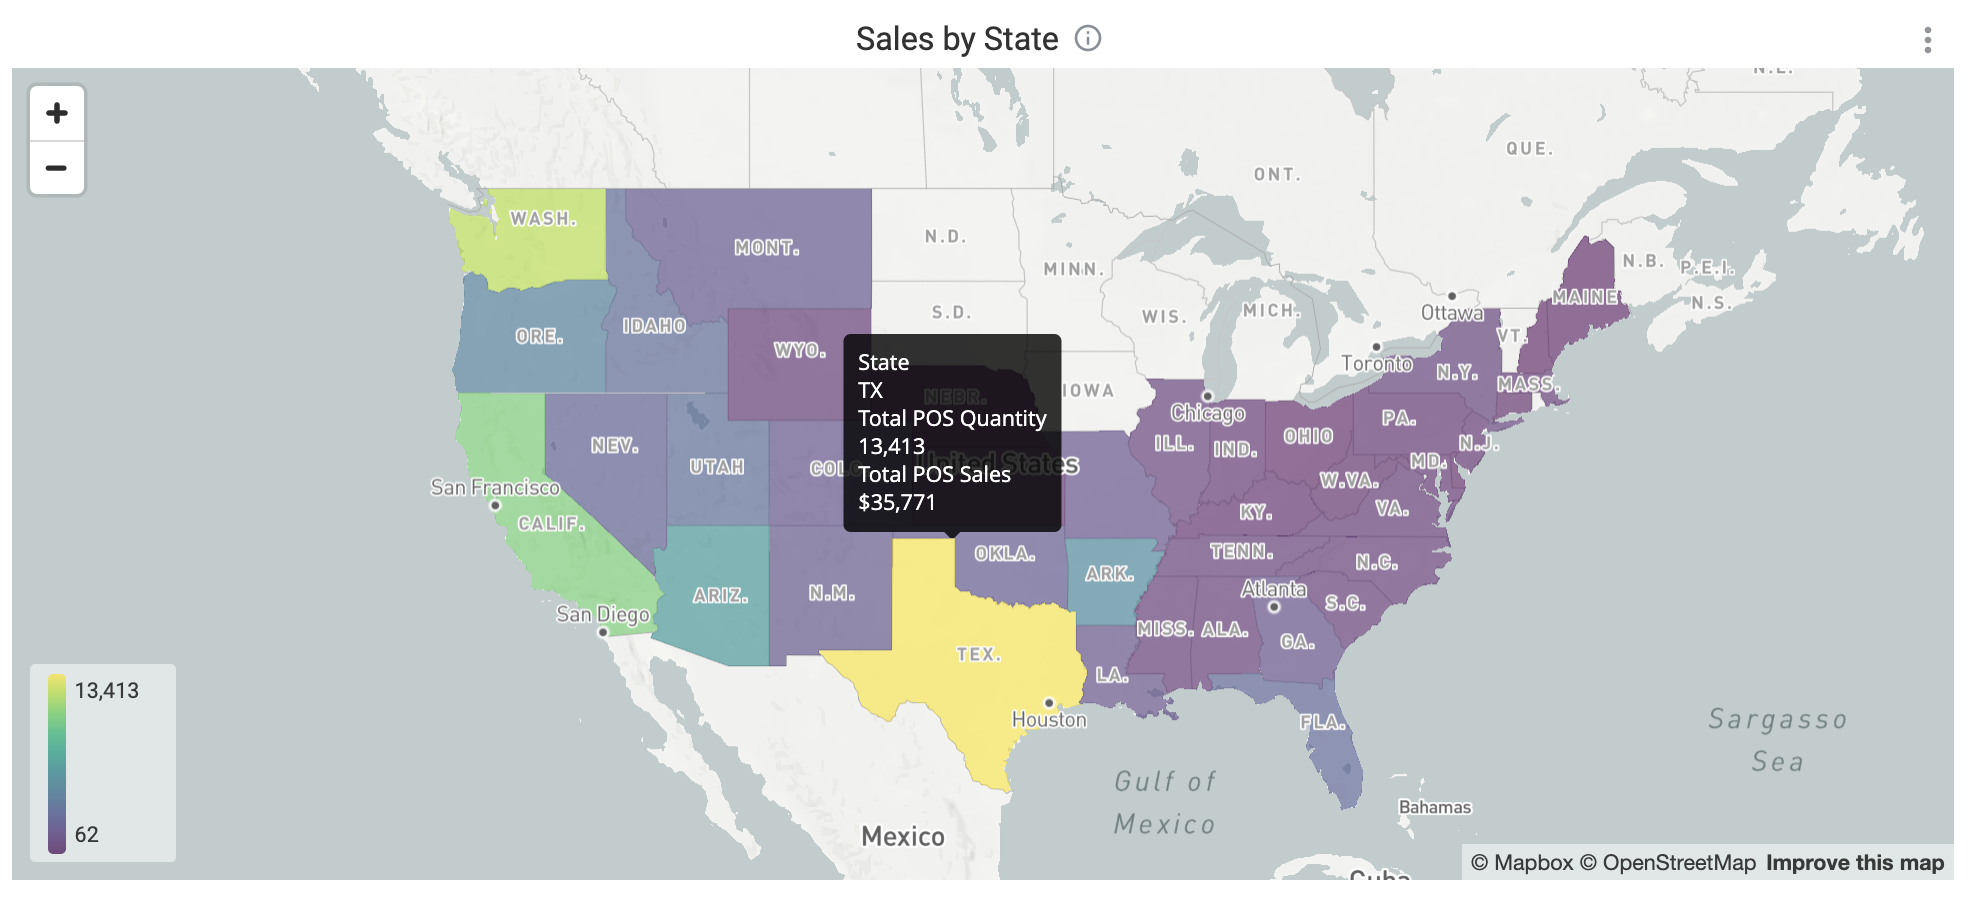
Sales by State
This regional heat map allows you to quickly observe states where product popularity is high versus states that are underperforming. States can drilled into by zip code by right-clicking, enabling your team to make more strategic decisions on where to allocate attention and resources.
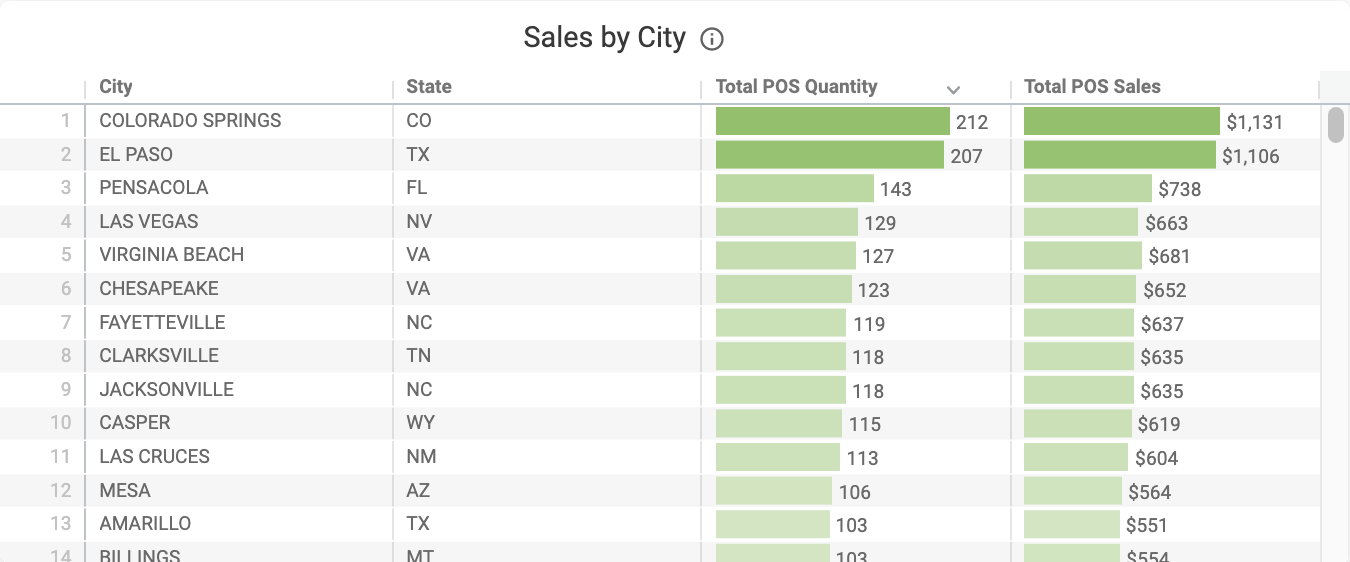
Sales by City
This sortable table can help you spot top-performing cities, which can aid in making decisions on product placement, as well as geo-targeting.
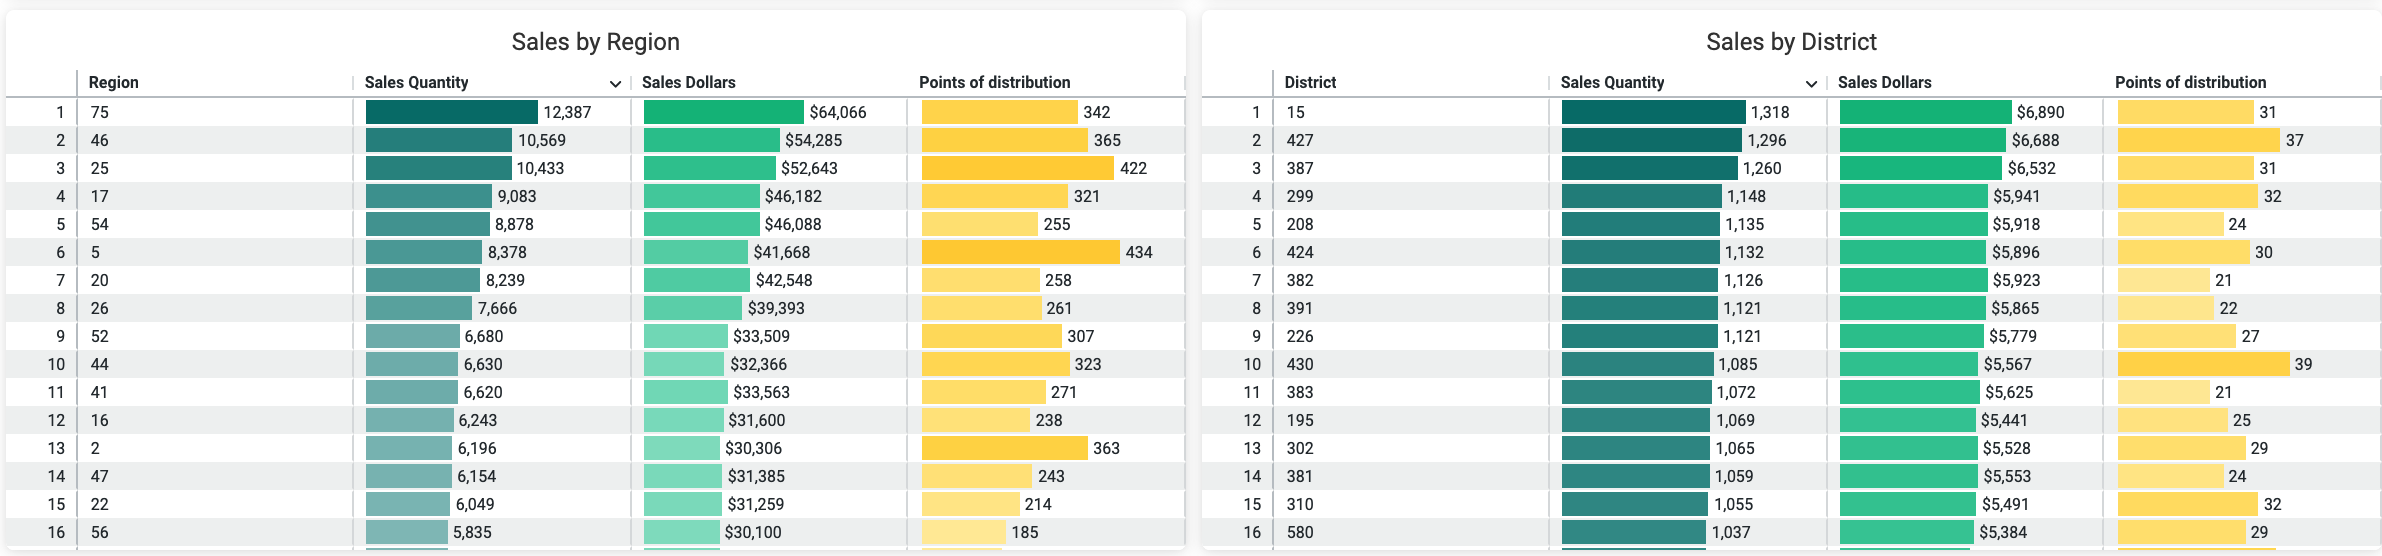
Sales by Region, District
These sortable tables provide another way to slice your Walmart data.
Sales by Store Type
See at a glance POS data by store type, helping you identify which products do better in which format. When used with a date filter, you can see which formats do better at certain times of the year.
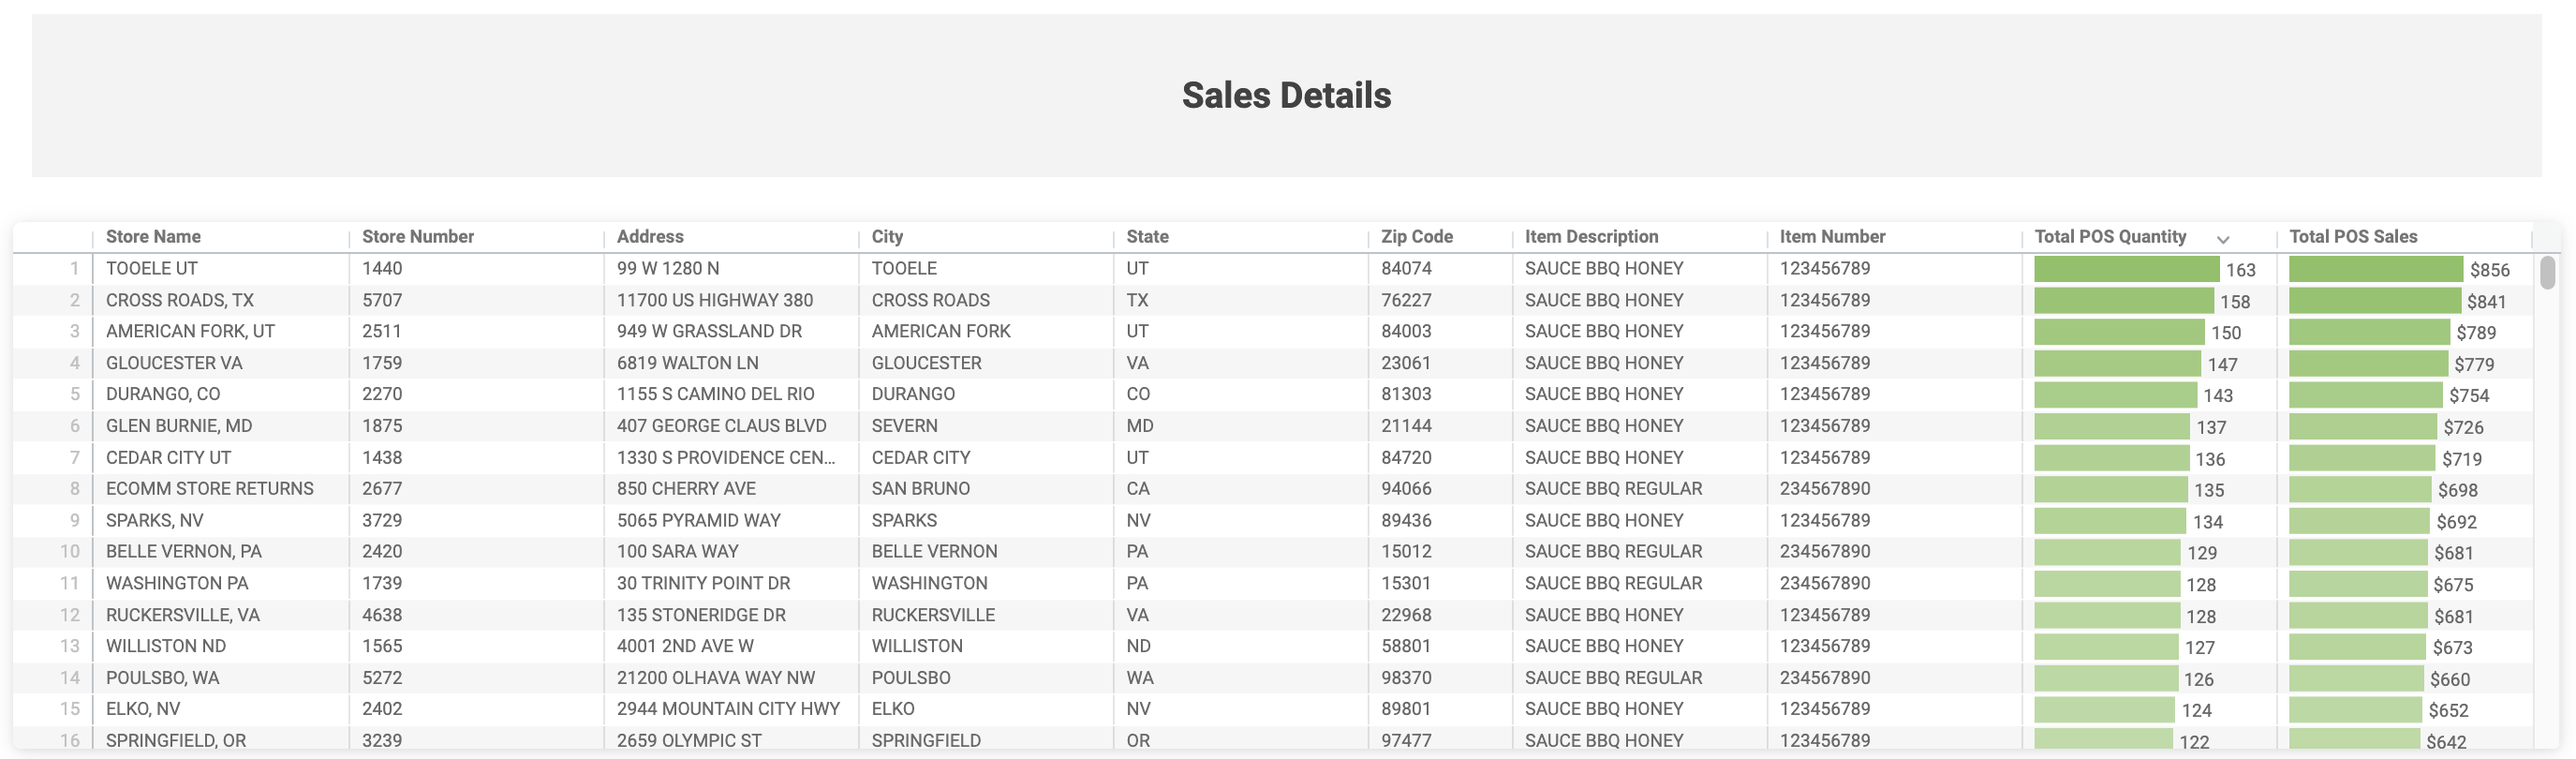
Sales Details
This comprehensive and sortable table surfaces your total POS sales by store+product combination, giving you a store-level look at item sales.