Pulling information directly from UNFI, the chargebacks dashboard reveals trade spend insights in a number of ways that can help you improve your profitability. In this tutorial, you will learn about each visualization available through the UNFI chargebacks dashboard. Quickly jump to a specific visualization by clicking the links below.
Chargebacks Over Time
Total Sales Dollars, Chargeback Dollars, Chargeback % of Sales
Chargebacks by Chain
Chargebacks by Code
Chargebacks % of Sales by State
Chargebacks by Product
Chargebacks by DC
Chargebacks Detail
Chargebacks Over Time
The vertical bars in this line chart compare your total sales in dollars (green) with your total chargebacks in dollars (pink). The chargeback percentage of your sales (purple) overlays these bars. This can help you determine whether your spend has had a positive impact on sales.

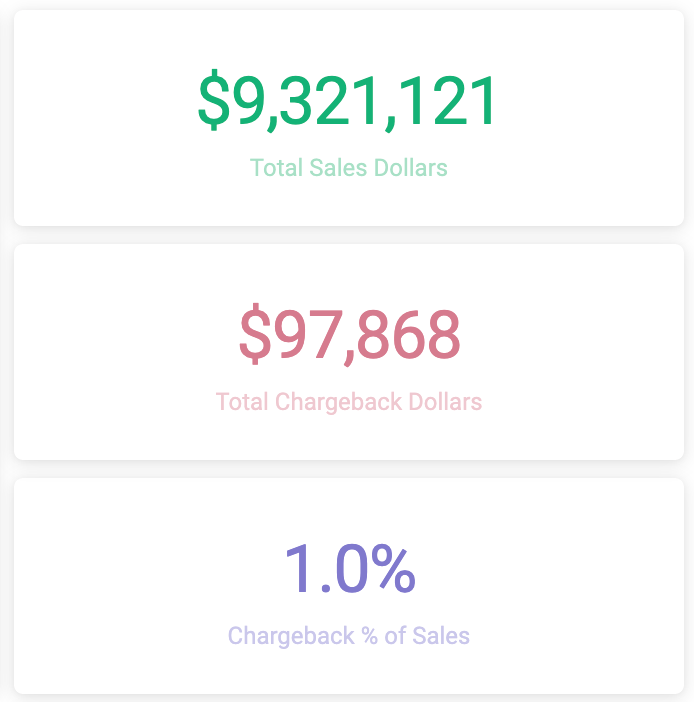
Total Sales Dollars, Chargeback Dollars, Chargeback % of Sales
To the right of "Chargebacks Over Time" are three tiles that show the total sales in dollars, total chargebacks in dollars, and total chargeback percentage of sales. By filtering for seasonal periods or times of heavy promotion, you can better identify how much lift is driven by spend.
Chargebacks by Chain
Sliced by chain, this sortable table allows you to see chargeback dollars by retailer. This helps answer the question, "How efficient is that retailer at giving me a return on my investment?"

Chargebacks by Code
This chart breaks down the types of chargebacks that appear in the dashboard, and you can hover over each slice for more information. Please note that clicking a slice to filter by chargeback code will result in 0 sales since we cannot attribute sales figures to a given chargeback code without duplication.

Chargebacks % of Sales by State
Based on the chargeback percentage of your sales, this map points to which areas of the country could be more efficient to spend your money in.

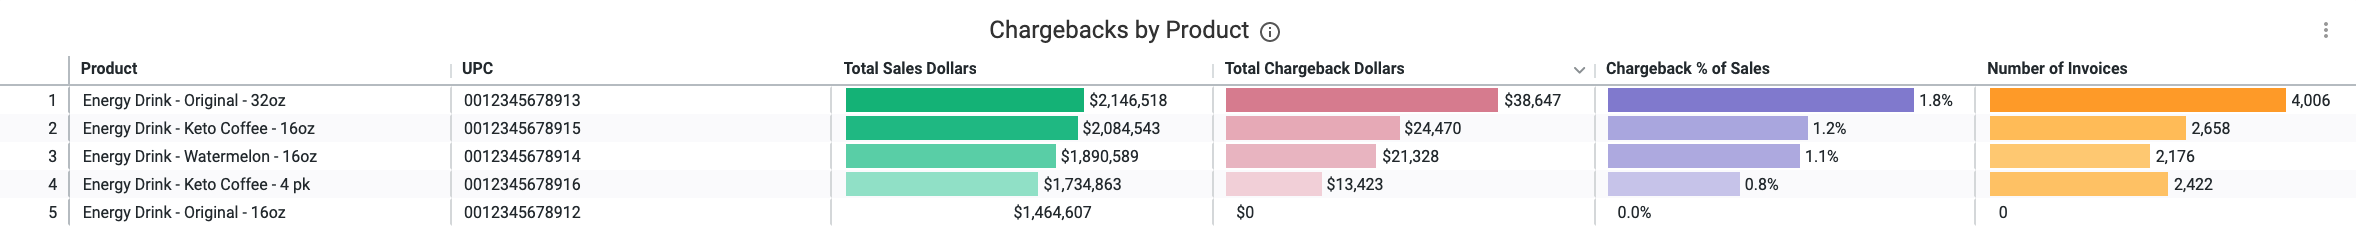
Chargebacks by Product
This table can be used to identify products that are doing well and could be worth investing in for promotions. By filtering for a specific retailer, you can also see how efficient your spend is with them. Click the column headers to sort by ascending or descending value.
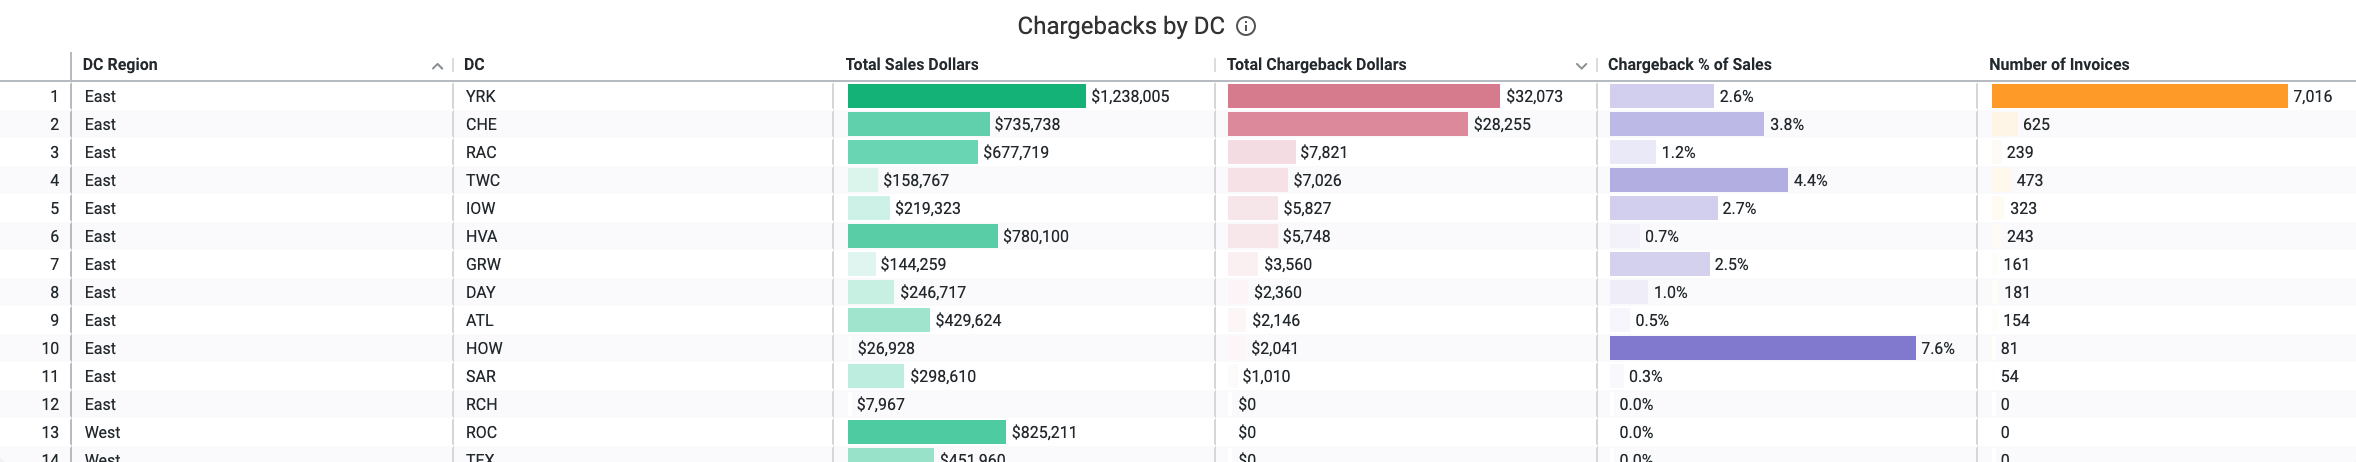
Chargebacks by DC
Offering another view of spend is the sortable "Chargebacks by DC" table.
Chargebacks Detail
The final table, "Chargebacks Detail," displays store-level details and invoice numbers along with chargeback dollars. Hover over the right corner of the table and click the "⋮" ellipses to download.
