You can check the status of an inbound connector to see the progress of a new connection, confirm how current your data is, or diagnose data ingestion failures and troubleshoot them on your own or with the help of Crisp support.
To check your ingestion status:
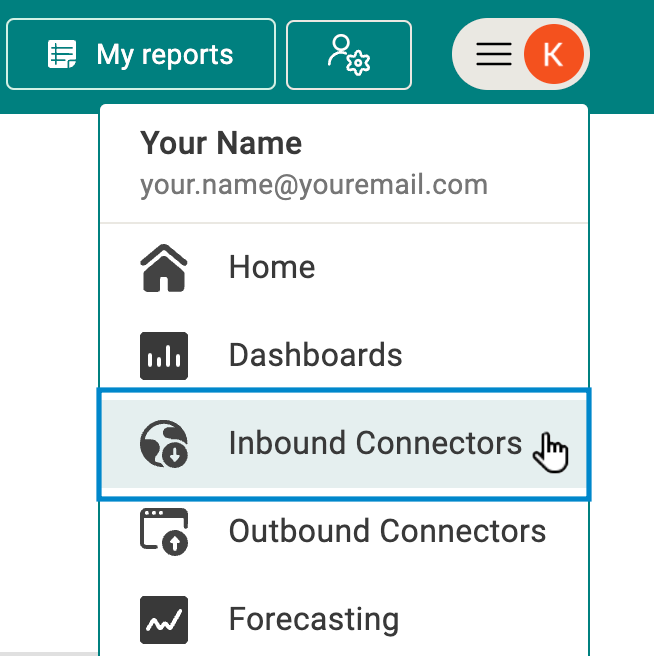
- From the main menu at the top-right of the screen, select Inbound Connectors.
The Connectors screen appears with list of your connectors. - Select the connector for which you want to check the status (e.g., Amazon Seller Central).
Hint: A red exclamation point in the top-right corner of a connector tile indicates a problem with your connection. You can usually resolve this by updating your log in information or token for the connector.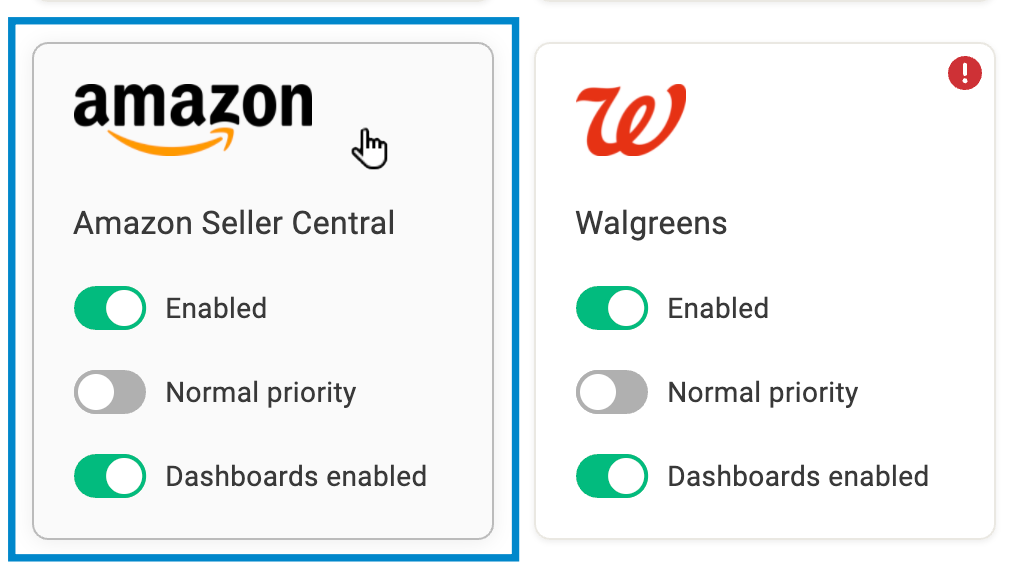
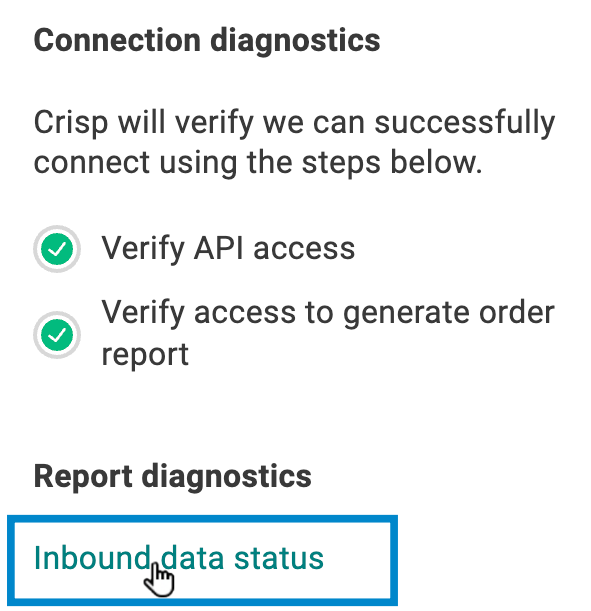
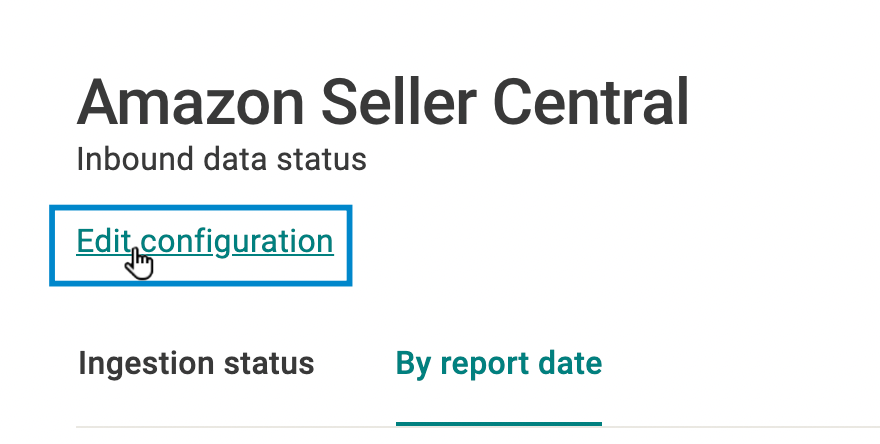
- From the Report Diagnostics section on the right of the screen, select Inbound data status.
The Inbound data status screen appears and displays an overview of the connector status. - Review the connection status overview. Use the following map of the screen to guide you.
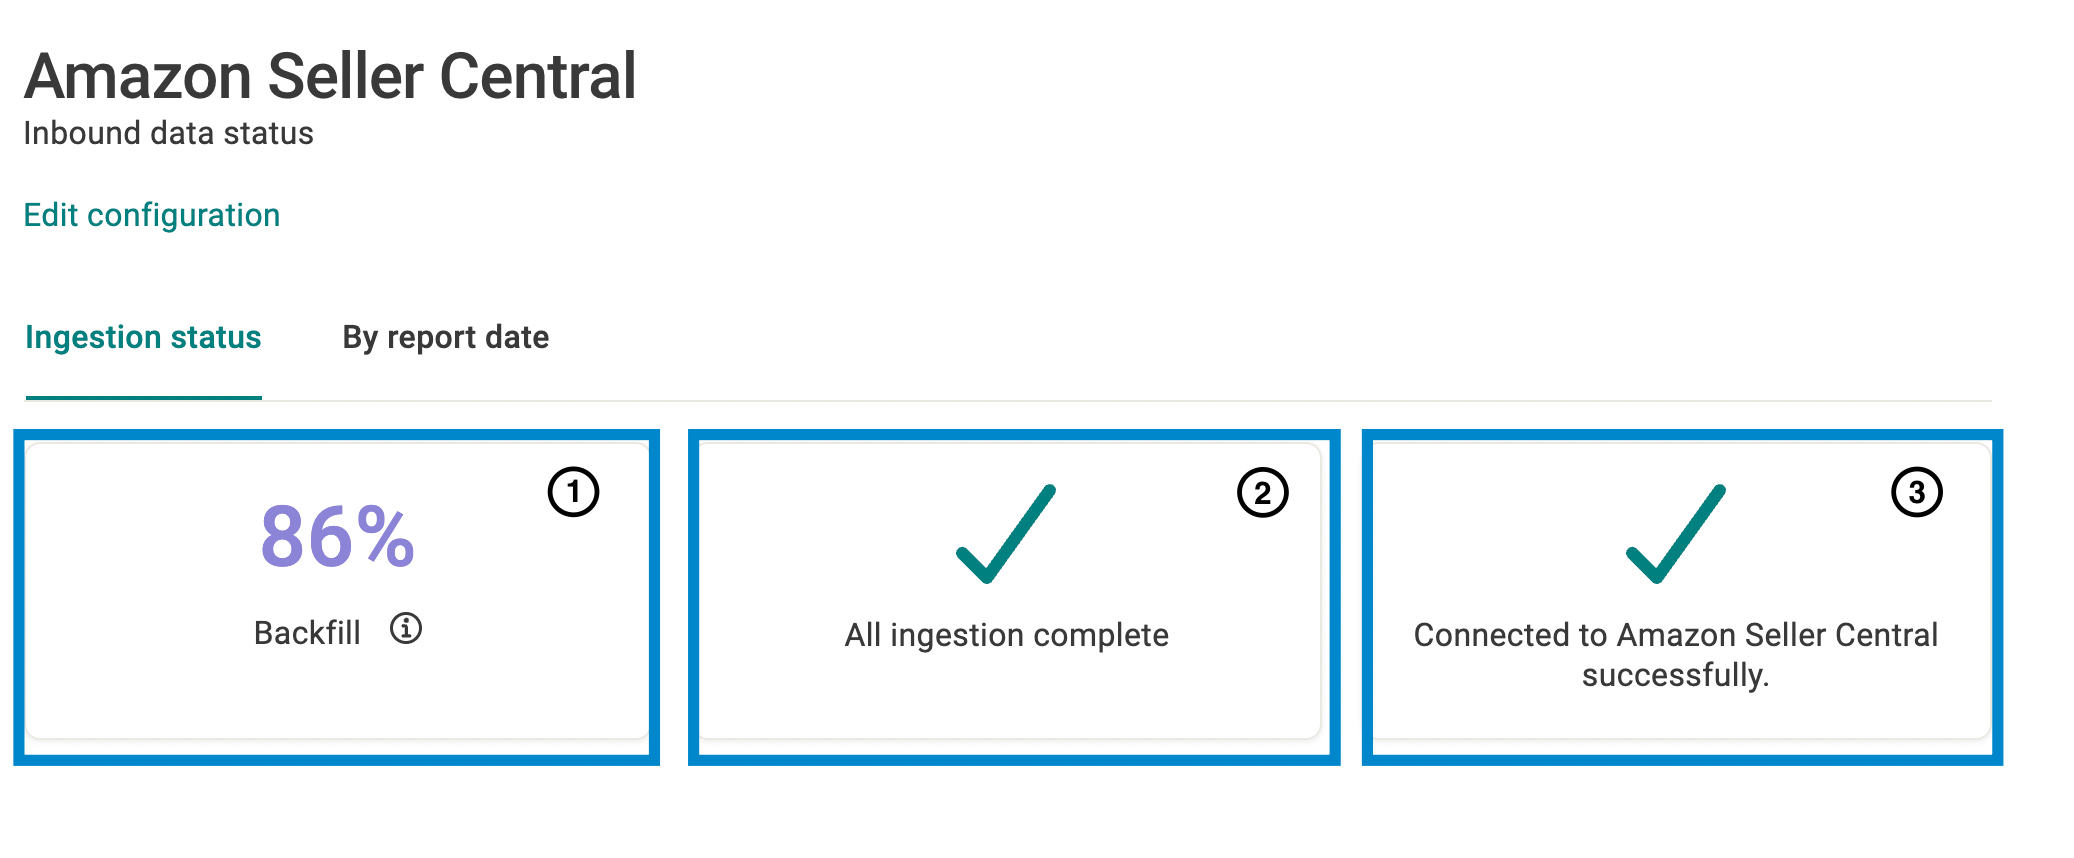
 Backfill tile: Displays the percentage of initial report download and processing tasks that are complete. This percentage only applies to the ingestion of data from prior to the creation of the connector and can help you understand how complete an initial setup is.
Note: Once all backfill tasks are complete, it can take up to an additional four hours for your data dashboard(s) to be available. Ingestion status tile: Indicates the status of all report download and processing tasks for the connector. Ingestions tasks have the following statuses: Pending, Failed or All ingestion complete.
  Connection diagnostics tile: Indicates the status of the connection to your retailer portal and provides troubleshooting information if the connection has failed, such as because your credentials are out of date.
 - If you want to see a more detailed breakdown of your connection status by date:
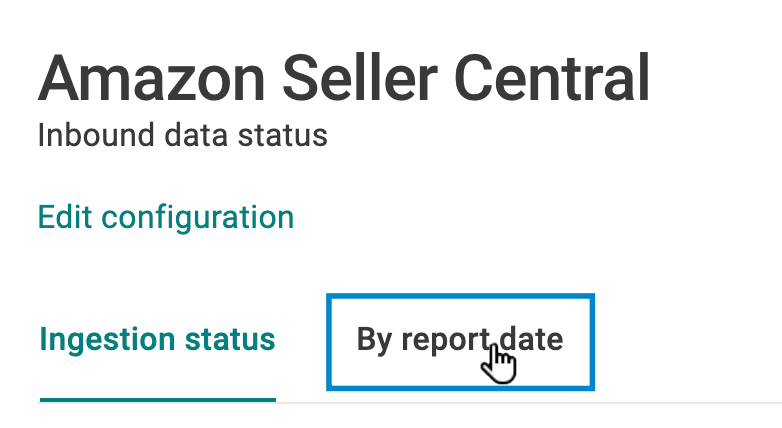
- Select the By report date tab.
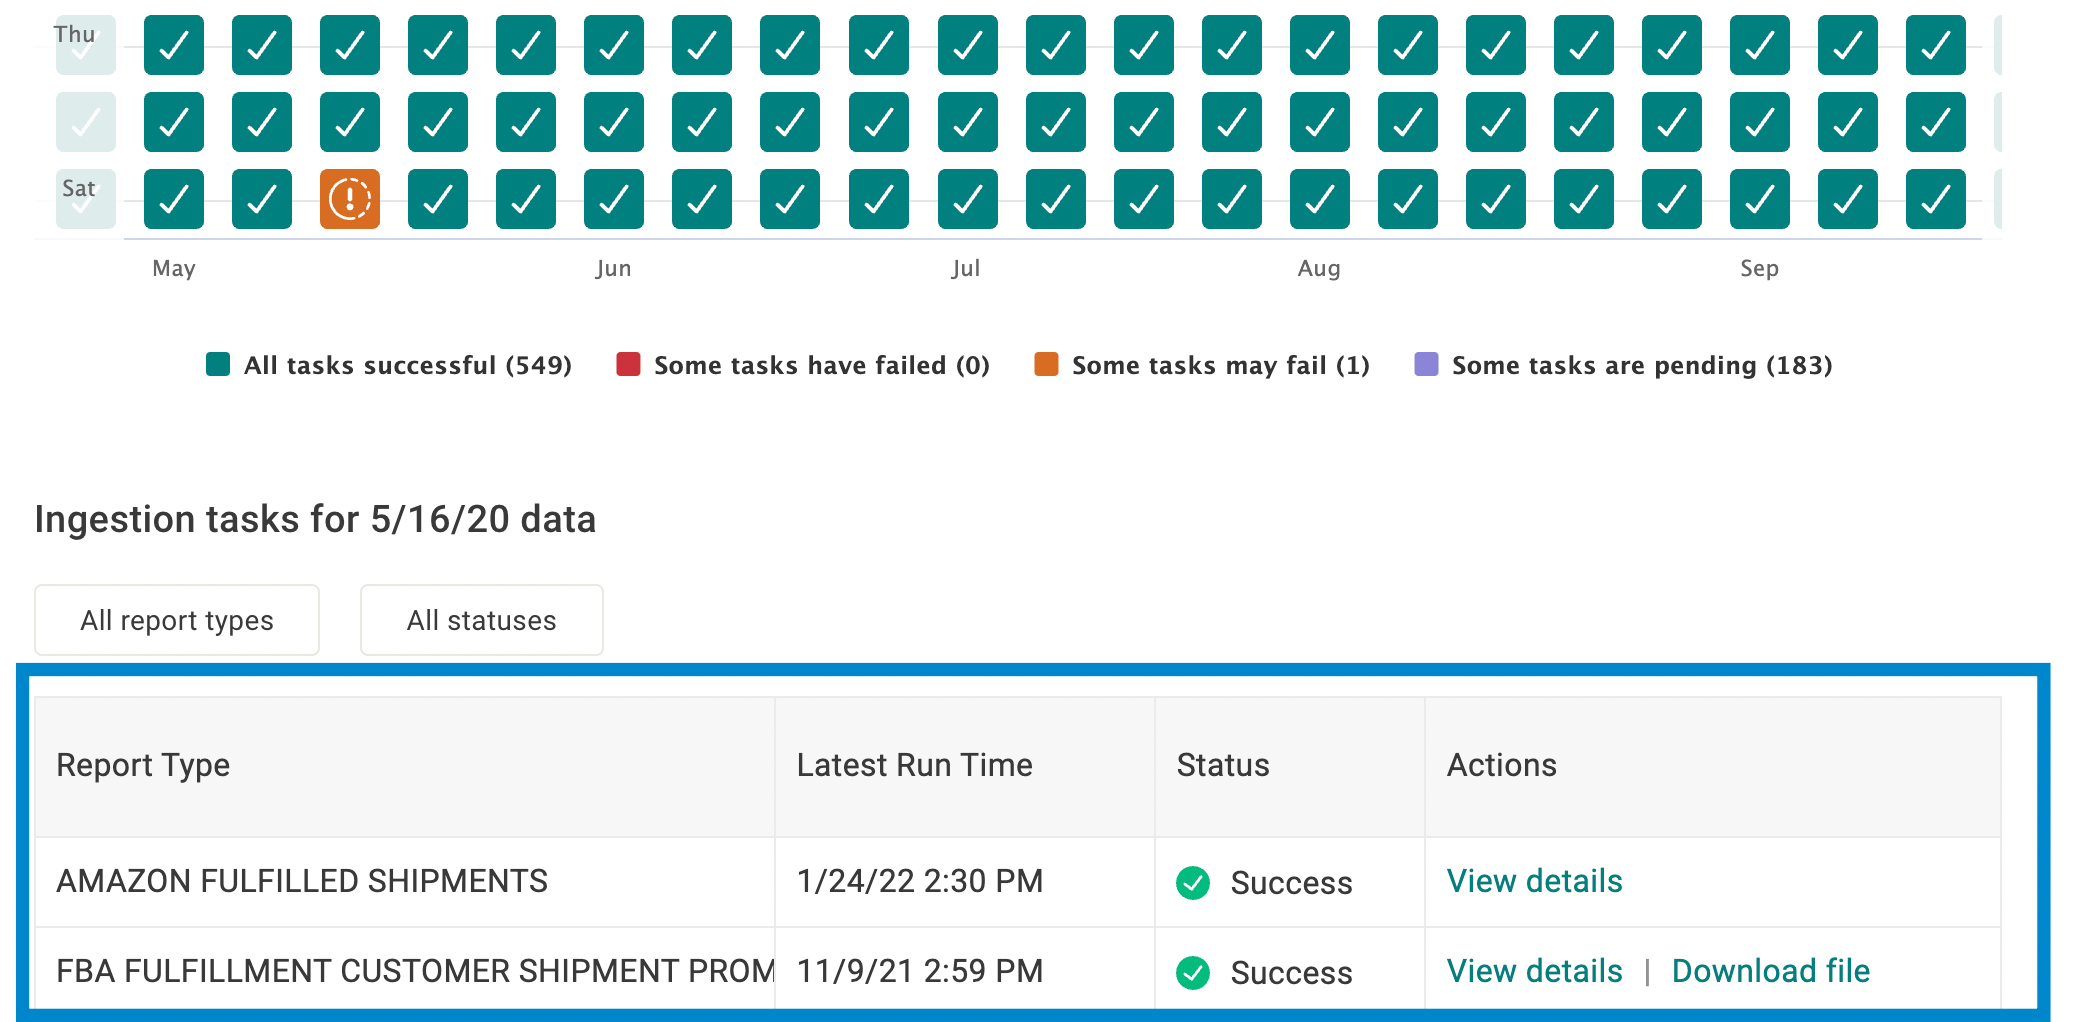
A table appears and displays icons indicating the data ingestion status for each day.
- To filter the dates displayed in the Ingestion by date table, select a date filter:
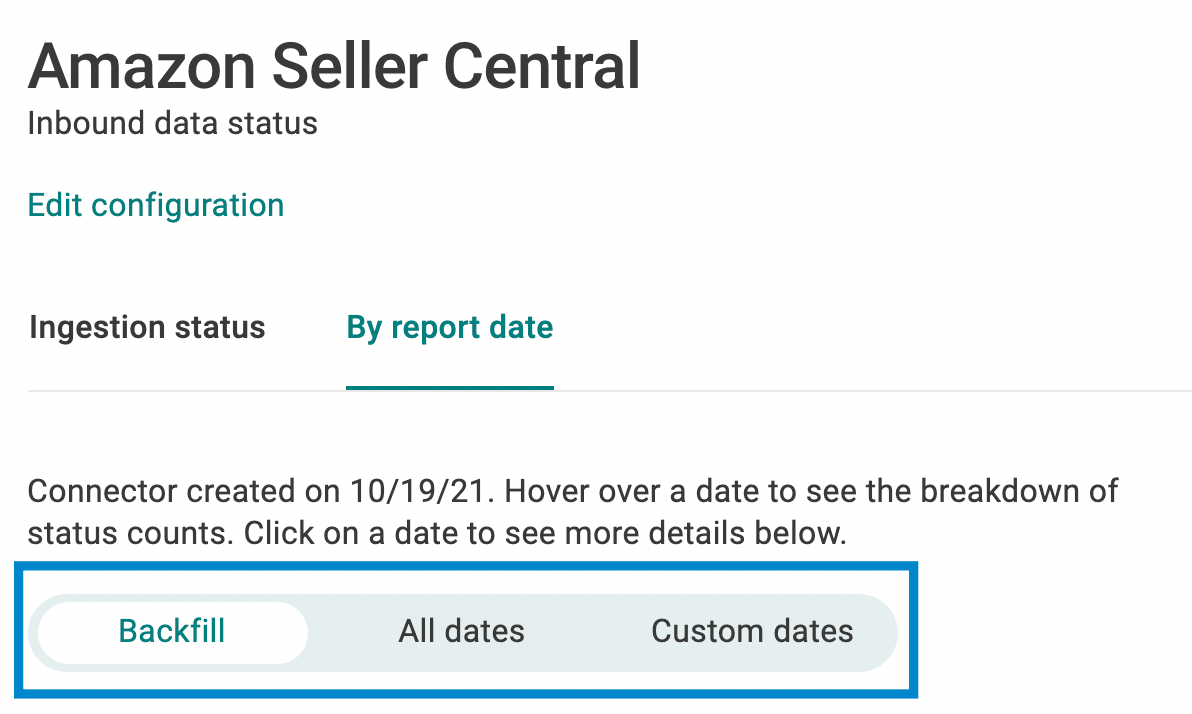
- Backfill: Displays the status of all the data collected from before the connector configuration was created.
- All dates: Displays the status of all the data collected, both before and after the connector configuration was created.
- Custom dates: Allows you to choose a specific date range to display in the ingestion status table.
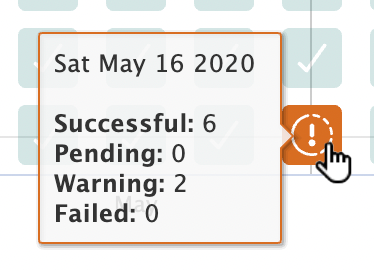
- To get an overview of tasks for a specific date, hover over the date to see the number of tasks attempted and their status.
- To see a detailed list of reports and status details for a specific date, select a date icon.
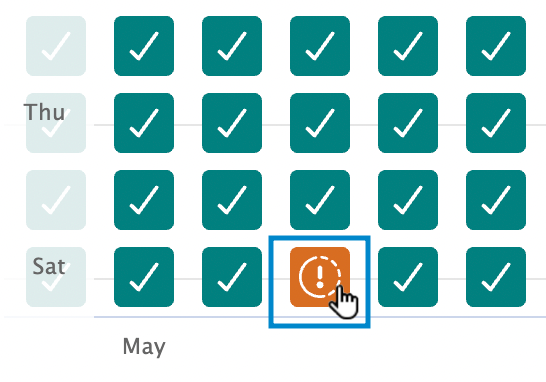
An ingestion tasks table appears for the selected date and includes a list of every report run that day and its status.
- Select the By report date tab.
- If you want to return to your configuration setup screen to try to resolve an issue, select the Edit configuration link at the top of the screen.
If you need further assistance with your connector, please contact Crisp support.